
Author: Jason Brownlee
The Frechet Inception Distance score, or FID for short, is a metric that calculates the distance between feature vectors calculated for real and generated images.
The score summarizes how similar the two groups are in terms of statistics on computer vision features of the raw images calculated using the inception v3 model used for image classification. Lower scores indicate the two groups of images are more similar, or have more similar statistics, with a perfect score being 0.0 indicating that the two groups of images are identical.
The FID score is used to evaluate the quality of images generated by generative adversarial networks, and lower scores have been shown to correlate well with higher quality images.
In this tutorial, you will discover how to implement the Frechet Inception Distance for evaluating generated images.
After completing this tutorial, you will know:
- The Frechet Inception Distance summarizes the distance between the Inception feature vectors for real and generated images in the same domain.
- How to calculate the FID score and implement the calculation from scratch in NumPy.
- How to implement the FID score using the Keras deep learning library and calculate it with real images.
Discover how to develop DCGANs, conditional GANs, Pix2Pix, CycleGANs, and more with Keras in my new GANs book, with 29 step-by-step tutorials and full source code.
Let’s get started.

How to Implement the Frechet Inception Distance (FID) From Scratch for Evaluating Generated Images
Photo by dronepicr, some rights reserved.
Tutorial Overview
This tutorial is divided into five parts; they are:
- What Is the Frechet Inception Distance?
- How to Calculate the Frechet Inception Distance
- How to Implement the Frechet Inception Distance With NumPy
- How to Implement the Frechet Inception Distance With Keras
- How to Calculate the Frechet Inception Distance for Real Images
What Is the Frechet Inception Distance?
The Frechet Inception Distance, or FID for short, is a metric for evaluating the quality of generated images and specifically developed to evaluate the performance of generative adversarial networks.
The FID score was proposed and used by Martin Heusel, et al. in their 2017 paper titled “GANs Trained by a Two Time-Scale Update Rule Converge to a Local Nash Equilibrium.”
The score was proposed as an improvement over the existing Inception Score, or IS.
For the evaluation of the performance of GANs at image generation, we introduce the “Frechet Inception Distance” (FID) which captures the similarity of generated images to real ones better than the Inception Score.
— GANs Trained by a Two Time-Scale Update Rule Converge to a Local Nash Equilibrium, 2017.
The inception score estimates the quality of a collection of synthetic images based on how well the top-performing image classification model Inception v3 classifies them as one of 1,000 known objects. The scores combine both the confidence of the conditional class predictions for each synthetic image (quality) and the integral of the marginal probability of the predicted classes (diversity).
The inception score does not capture how synthetic images compare to real images. The goal in developing the FID score was to evaluate synthetic images based on the statistics of a collection of synthetic images compared to the statistics of a collection of real images from the target domain.
Drawback of the Inception Score is that the statistics of real world samples are not used and compared to the statistics of synthetic samples.
— GANs Trained by a Two Time-Scale Update Rule Converge to a Local Nash Equilibrium, 2017.
Like the inception score, the FID score uses the inception v3 model. Specifically, the coding layer of the model (the last pooling layer prior to the output classification of images) is used to capture computer-vision-specific features of an input image. These activations are calculated for a collection of real and generated images.
The activations are summarized as a multivariate Gaussian by calculating the mean and covariance of the images. These statistics are then calculated for the activations across the collection of real and generated images.
The distance between these two distributions is then calculated using the Frechet distance, also called the Wasserstein-2 distance.
The difference of two Gaussians (synthetic and real-world images) is measured by the Frechet distance also known as Wasserstein-2 distance.
— GANs Trained by a Two Time-Scale Update Rule Converge to a Local Nash Equilibrium, 2017.
The use of activations from the Inception v3 model to summarize each image gives the score its name of “Frechet Inception Distance.”
A lower FID indicates better-quality images; conversely, a higher score indicates a lower-quality image and the relationship may be linear.
The authors of the score show that lower FID scores correlate with better-quality images when systematic distortions were applied such as the addition of random noise and blur.
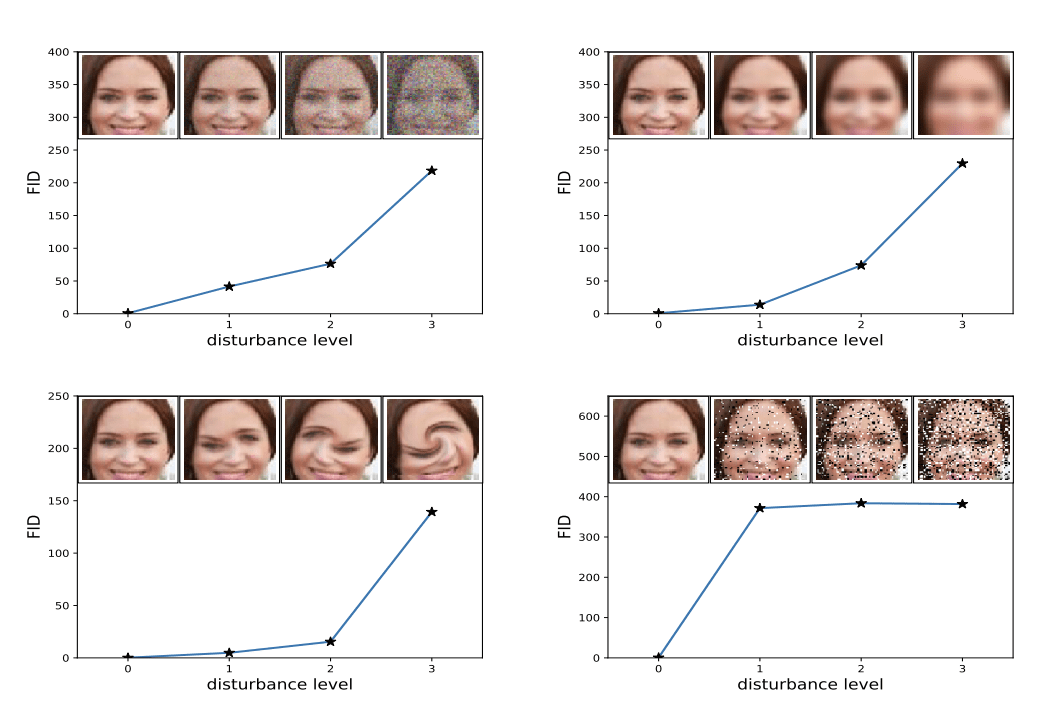
Example of How Increased Distortion of an Image Correlates with High FID Score.
Taken from: GANs Trained by a Two Time-Scale Update Rule Converge to a Local Nash Equilibrium.
How to Calculate the Frechet Inception Distance
The FID score is calculated by first loading a pre-trained Inception v3 model.
The output layer of the model is removed and the output is taken as the activations from the last pooling layer, a global spatial pooling layer.
This output layer has 2,048 activations, therefore, each image is predicted as 2,048 activation features. This is called the coding vector or feature vector for the image.
A 2,048 feature vector is then predicted for a collection of real images from the problem domain to provide a reference for how real images are represented. Feature vectors can then be calculated for synthetic images.
The result will be two collections of 2,048 feature vectors for real and generated images.
The FID score is then calculated using the following equation taken from the paper:
- d^2 = ||mu_1 – mu_2||^2 + Tr(C_1 + C_2 – 2*sqrt(C_1*C_2))
The score is referred to as d^2, showing that it is a distance and has squared units.
The “mu_1” and “mu_2” refer to the feature-wise mean of the real and generated images, e.g. 2,048 element vectors where each element is the mean feature observed across the images.
The C_1 and C_1 are the covariance matrix for the real and generated feature vectors, often referred to as sigma.
The ||mu_1 – mu_2||^2 refers to the sum squared difference between the two mean vectors. Tr refers to the trace linear algebra operation, e.g. the sum of the elements along the main diagonal of the square matrix.
The sqrt is the square root of the square matrix, given as the product between the two covariance matrices.
The square root of a matrix is often also written as M^(1/2), e.g. the matrix to the power of one half, which has the same effect. This operation can fail depending on the values in the matrix because the operation is solved using numerical methods. Commonly, some elements in the resulting matrix may be imaginary, which often can be detected and removed.
Want to Develop GANs from Scratch?
Take my free 7-day email crash course now (with sample code).
Click to sign-up and also get a free PDF Ebook version of the course.
How to Implement the Frechet Inception Distance With NumPy
Implementing the calculation of the FID score in Python with NumPy arrays is straightforward.
First, let’s define a function that will take a collection of activations for real and generated images and return the FID score.
The calculate_fid() function listed below implements the procedure.
Here, we implement the FID calculation almost directly. It is worth noting that the official implementation in TensorFlow implements elements of the calculation in a slightly different order, likely for efficiency, and introduces additional checks around the matrix square root to handle possible numerical instabilities.
I recommend reviewing the official implementation and extending the implementation below to add these checks if you experience problems calculating the FID on your own datasets.
# calculate frechet inception distance
def calculate_fid(act1, act2):
	# calculate mean and covariance statistics
	mu1, sigma1 = act1.mean(axis=0), cov(act1, rowvar=False)
	mu2, sigma2 = act2.mean(axis=0), cov(act2, rowvar=False)
	# calculate sum squared difference between means
	ssdiff = numpy.sum((mu1 - mu2)**2.0)
	# calculate sqrt of product between cov
	covmean = sqrtm(sigma1.dot(sigma2))
	# check and correct imaginary numbers from sqrt
	if iscomplexobj(covmean):
		covmean = covmean.real
	# calculate score
	fid = ssdiff + trace(sigma1 + sigma2 - 2.0 * covmean)
	return fid
We can then test out this function to calculate the inception score for some contrived feature vectors.
Feature vectors will probably contain small positive values and will have a length of 2,048 elements. We can construct two lots of 10 images worth of feature vectors with small random numbers as follows:
...
# define two collections of activations
act1 = random(10*2048)
act1 = act1.reshape((10,2048))
act2 = random(10*2048)
act2 = act2.reshape((10,2048))
One test would be to calculate the FID between a set of activations and itself, which we would expect to have a score of 0.0.
We can then calculate the distance between the two sets of random activations, which we would expect to be a large number.
...
# fid between act1 and act1
fid = calculate_fid(act1, act1)
print('FID (same): %.3f' % fid)
# fid between act1 and act2
fid = calculate_fid(act1, act2)
print('FID (different): %.3f' % fid)
Tying this all together, the complete example is listed below.
# example of calculating the frechet inception distance
import numpy
from numpy import cov
from numpy import trace
from numpy import iscomplexobj
from numpy.random import random
from scipy.linalg import sqrtm

# calculate frechet inception distance
def calculate_fid(act1, act2):
	# calculate mean and covariance statistics
	mu1, sigma1 = act1.mean(axis=0), cov(act1, rowvar=False)
	mu2, sigma2 = act2.mean(axis=0), cov(act2, rowvar=False)
	# calculate sum squared difference between means
	ssdiff = numpy.sum((mu1 - mu2)**2.0)
	# calculate sqrt of product between cov
	covmean = sqrtm(sigma1.dot(sigma2))
	# check and correct imaginary numbers from sqrt
	if iscomplexobj(covmean):
		covmean = covmean.real
	# calculate score
	fid = ssdiff + trace(sigma1 + sigma2 - 2.0 * covmean)
	return fid

# define two collections of activations
act1 = random(10*2048)
act1 = act1.reshape((10,2048))
act2 = random(10*2048)
act2 = act2.reshape((10,2048))
# fid between act1 and act1
fid = calculate_fid(act1, act1)
print('FID (same): %.3f' % fid)
# fid between act1 and act2
fid = calculate_fid(act1, act2)
print('FID (different): %.3f' % fid)
Running the example first reports the FID between the act1 activations and itself, which is 0.0 as we expect (Note: the sign of the score can be ignored).
The distance between the two collections of random activations is also as we expect: a large number, which in this case was 358.
FID (same): -0.000
FID (different): 358.927
You may want to experiment with the calculation of the FID score and test other pathological cases.
How to Implement the Frechet Inception Distance With Keras
Now that we know how to calculate the FID score and to implement it in NumPy, we can develop an implementation in Keras.
This involves the preparation of the image data and using a pretrained Inception v3 model to calculate the activations or feature vectors for each image.
First, we can load the Inception v3 model in Keras directly.
...
# load inception v3 model
model = InceptionV3()
This will prepare a version of the inception model for classifying images as one of 1,000 known classes. We can remove the output (the top) of the model via the include_top=False argument. Painfully, this also removes the global average pooling layer that we require, but we can add it back via specifying the pooling=’avg’ argument.
When the output layer of the model is removed, we must specify the shape of the input images, which is 299x299x3 pixels, e.g. the input_shape=(299,299,3) argument.
Therefore, the inception model can be loaded as follows:
...
# prepare the inception v3 model
model = InceptionV3(include_top=False, pooling='avg', input_shape=(299,299,3))
This model can then be used to predict the feature vector for one or more images.
Our images are likely to not have the required shape. We will use the scikit-image library to resize the NumPy array of pixel values to the required size. The scale_images() function below implements this.
# scale an array of images to a new size
def scale_images(images, new_shape):
	images_list = list()
	for image in images:
		# resize with nearest neighbor interpolation
		new_image = resize(image, new_shape, 0)
		# store
		images_list.append(new_image)
	return asarray(images_list)
Note, you may need to install the scikit-image library. This can be achieved as follows:
sudo pip install scikit-image
Once resized, the image pixel values will also need to be scaled to meet the expectations for inputs to the inception model. This can be achieved by calling the preprocess_input() function.
We can update our calculate_fid() function defined in the previous section to take the loaded inception model and two NumPy arrays of image data as arguments, instead of activations. The function will then calculate the activations before calculating the FID score as before.
The updated version of the calculate_fid() function is listed below.
# calculate frechet inception distance
def calculate_fid(model, images1, images2):
	# calculate activations
	act1 = model.predict(images1)
	act2 = model.predict(images2)
	# calculate mean and covariance statistics
	mu1, sigma1 = act1.mean(axis=0), cov(act1, rowvar=False)
	mu2, sigma2 = act2.mean(axis=0), cov(act2, rowvar=False)
	# calculate sum squared difference between means
	ssdiff = numpy.sum((mu1 - mu2)**2.0)
	# calculate sqrt of product between cov
	covmean = sqrtm(sigma1.dot(sigma2))
	# check and correct imaginary numbers from sqrt
	if iscomplexobj(covmean):
		covmean = covmean.real
	# calculate score
	fid = ssdiff + trace(sigma1 + sigma2 - 2.0 * covmean)
	return fid
We can then test this function with some contrived collections of images, in this case, 10 32×32 images with random pixel values in the range [0,255].
...
# define two fake collections of images
images1 = randint(0, 255, 10*32*32*3)
images1 = images1.reshape((10,32,32,3))
images2 = randint(0, 255, 10*32*32*3)
images2 = images2.reshape((10,32,32,3))
We can then convert the integer pixel values to floating point values and scale them to the required size of 299×299 pixels.
...
# convert integer to floating point values
images1 = images1.astype('float32')
images2 = images2.astype('float32')
# resize images
images1 = scale_images(images1, (299,299,3))
images2 = scale_images(images2, (299,299,3))
Then the pixel values can be scaled to meet the expectations of the Inception v3 model.
...
# pre-process images
images1 = preprocess_input(images1)
images2 = preprocess_input(images2)
Then calculate the FID scores, first between a collection of images and itself, then between the two collections of images.
...
# fid between images1 and images1
fid = calculate_fid(model, images1, images1)
print('FID (same): %.3f' % fid)
# fid between images1 and images2
fid = calculate_fid(model, images1, images2)
print('FID (different): %.3f' % fid)
Tying all of this together, the complete example is listed below.
# example of calculating the frechet inception distance in Keras
import numpy
from numpy import cov
from numpy import trace
from numpy import iscomplexobj
from numpy import asarray
from numpy.random import randint
from scipy.linalg import sqrtm
from keras.applications.inception_v3 import InceptionV3
from keras.applications.inception_v3 import preprocess_input
from keras.datasets.mnist import load_data
from skimage.transform import resize

# scale an array of images to a new size
def scale_images(images, new_shape):
	images_list = list()
	for image in images:
		# resize with nearest neighbor interpolation
		new_image = resize(image, new_shape, 0)
		# store
		images_list.append(new_image)
	return asarray(images_list)

# calculate frechet inception distance
def calculate_fid(model, images1, images2):
	# calculate activations
	act1 = model.predict(images1)
	act2 = model.predict(images2)
	# calculate mean and covariance statistics
	mu1, sigma1 = act1.mean(axis=0), cov(act1, rowvar=False)
	mu2, sigma2 = act2.mean(axis=0), cov(act2, rowvar=False)
	# calculate sum squared difference between means
	ssdiff = numpy.sum((mu1 - mu2)**2.0)
	# calculate sqrt of product between cov
	covmean = sqrtm(sigma1.dot(sigma2))
	# check and correct imaginary numbers from sqrt
	if iscomplexobj(covmean):
		covmean = covmean.real
	# calculate score
	fid = ssdiff + trace(sigma1 + sigma2 - 2.0 * covmean)
	return fid

# prepare the inception v3 model
model = InceptionV3(include_top=False, pooling='avg', input_shape=(299,299,3))
# define two fake collections of images
images1 = randint(0, 255, 10*32*32*3)
images1 = images1.reshape((10,32,32,3))
images2 = randint(0, 255, 10*32*32*3)
images2 = images2.reshape((10,32,32,3))
print('Prepared', images1.shape, images2.shape)
# convert integer to floating point values
images1 = images1.astype('float32')
images2 = images2.astype('float32')
# resize images
images1 = scale_images(images1, (299,299,3))
images2 = scale_images(images2, (299,299,3))
print('Scaled', images1.shape, images2.shape)
# pre-process images
images1 = preprocess_input(images1)
images2 = preprocess_input(images2)
# fid between images1 and images1
fid = calculate_fid(model, images1, images1)
print('FID (same): %.3f' % fid)
# fid between images1 and images2
fid = calculate_fid(model, images1, images2)
print('FID (different): %.3f' % fid)
Running the example first summarizes the shapes of the fabricated images and their rescaled versions, matching our expectations.
Note: the first time the InceptionV3 model is used, Keras will download the model weights and save them into the ~/.keras/models/ directory on your workstation. The weights are about 100 megabytes and may take a moment to download depending on the speed of your internet connection.
The FID score between a given set of images and itself is 0.0, as we expect, and the distance between the two collections of random images is about 35.
Prepared (10, 32, 32, 3) (10, 32, 32, 3)
Scaled (10, 299, 299, 3) (10, 299, 299, 3)
FID (same): -0.000
FID (different): 35.495
How to Calculate the Frechet Inception Distance for Real Images
It may be useful to calculate the FID score between two collections of real images.
The Keras library provides a number of computer vision datasets, including the CIFAR-10 dataset. These are color photos with the small size of 32×32 pixels and is split into train and test elements and can be loaded as follows:
...
# load cifar10 images
(images1, _), (images2, _) = cifar10.load_data()
The training dataset has 50,000 images, whereas the test dataset has only 10,000 images. It may be interesting to calculate the FID score between these two datasets to get an idea of how representative the test dataset is of the training dataset.
Scaling and scoring 50K images takes a long time, therefore, we can reduce the “training set” to a 10K random sample as follows:
...
shuffle(images1)
images1 = images1[:10000]
Tying this all together, we can calculate the FID score between a sample of the train and the test dataset as follows.
# example of calculating the frechet inception distance in Keras for cifar10
import numpy
from numpy import cov
from numpy import trace
from numpy import iscomplexobj
from numpy import asarray
from numpy.random import shuffle
from scipy.linalg import sqrtm
from keras.applications.inception_v3 import InceptionV3
from keras.applications.inception_v3 import preprocess_input
from keras.datasets.mnist import load_data
from skimage.transform import resize
from keras.datasets import cifar10

# scale an array of images to a new size
def scale_images(images, new_shape):
	images_list = list()
	for image in images:
		# resize with nearest neighbor interpolation
		new_image = resize(image, new_shape, 0)
		# store
		images_list.append(new_image)
	return asarray(images_list)

# calculate frechet inception distance
def calculate_fid(model, images1, images2):
	# calculate activations
	act1 = model.predict(images1)
	act2 = model.predict(images2)
	# calculate mean and covariance statistics
	mu1, sigma1 = act1.mean(axis=0), cov(act1, rowvar=False)
	mu2, sigma2 = act2.mean(axis=0), cov(act2, rowvar=False)
	# calculate sum squared difference between means
	ssdiff = numpy.sum((mu1 - mu2)**2.0)
	# calculate sqrt of product between cov
	covmean = sqrtm(sigma1.dot(sigma2))
	# check and correct imaginary numbers from sqrt
	if iscomplexobj(covmean):
		covmean = covmean.real
	# calculate score
	fid = ssdiff + trace(sigma1 + sigma2 - 2.0 * covmean)
	return fid

# prepare the inception v3 model
model = InceptionV3(include_top=False, pooling='avg', input_shape=(299,299,3))
# load cifar10 images
(images1, _), (images2, _) = cifar10.load_data()
shuffle(images1)
images1 = images1[:10000]
print('Loaded', images1.shape, images2.shape)
# convert integer to floating point values
images1 = images1.astype('float32')
images2 = images2.astype('float32')
# resize images
images1 = scale_images(images1, (299,299,3))
images2 = scale_images(images2, (299,299,3))
print('Scaled', images1.shape, images2.shape)
# pre-process images
images1 = preprocess_input(images1)
images2 = preprocess_input(images2)
# calculate fid
fid = calculate_fid(model, images1, images2)
print('FID: %.3f' % fid)
Running the example may take some time depending on the speed of your workstation.
At the end of the run, we can see that the FID score between the train and test datasets is about five.
Loaded (10000, 32, 32, 3) (10000, 32, 32, 3)
Scaled (10000, 299, 299, 3) (10000, 299, 299, 3)
FID: 5.492
Further Reading
This section provides more resources on the topic if you are looking to go deeper.
Papers
- GANs Trained by a Two Time-Scale Update Rule Converge to a Local Nash Equilibrium, 2017.
- Are GANs Created Equal? A Large-Scale Study, 2017.
- Pros and Cons of GAN Evaluation Measures, 2018.
Code Projects
- Official Implementation in TensorFlow, GitHub.
- Frechet Inception Distance (FID score) in PyTorch, GitHub.
API
- numpy.trace API.
- numpy.cov API.
- numpy.iscomplexobj API.
- Keras Inception v3 Model
- scikit-image Library
Articles
- Frechet Inception Distance, 2017.
- Frechet Inception Distance, 2018.
- Frechet distance, Wikipedia.
- Covariance matrix, Wikipedia.
- Square root of a matrix, Wikipedia.
Summary
In this tutorial, you discovered how to implement the Frechet Inception Distance for evaluating generated images.
Specifically, you learned:
- The Frechet Inception Distance summarizes the distance between the Inception feature vectors for real and generated images in the same domain.
- How to calculate the FID score and implement the calculation from scratch in NumPy.
- How to implement the FID score using the Keras deep learning library and calculate it with real images.
Do you have any questions?
Ask your questions in the comments below and I will do my best to answer.
The post How to Implement the Frechet Inception Distance (FID) for Evaluating GANs appeared first on Machine Learning Mastery.