
Author: Jason Brownlee
Machine learning models are chosen based on their mean performance, often calculated using k-fold cross-validation.
The algorithm with the best mean performance is expected to be better than those algorithms with worse mean performance. But what if the difference in the mean performance is caused by a statistical fluke?
The solution is to use a statistical hypothesis test to evaluate whether the difference in the mean performance between any two algorithms is real or not.
In this tutorial, you will discover how to use statistical hypothesis tests for comparing machine learning algorithms.
After completing this tutorial, you will know:
- Performing model selection based on the mean model performance can be misleading.
- The five repeats of two-fold cross-validation with a modified Student’s t-Test is a good practice for comparing machine learning algorithms.
- How to use the MLxtend machine learning to compare algorithms using a statistical hypothesis test.
Kick-start your project with my new book Statistics for Machine Learning, including step-by-step tutorials and the Python source code files for all examples.
Let’s get started.

Hypothesis Test for Comparing Machine Learning Algorithms
Photo by Frank Shepherd, some rights reserved.
Tutorial Overview
This tutorial is divided into three parts; they are:
- Hypothesis Test for Comparing Algorithms
- 5×2 Procedure With MLxtend
- Comparing Classifier Algorithms
Hypothesis Test for Comparing Algorithms
Model selection involves evaluating a suite of different machine learning algorithms or modeling pipelines and comparing them based on their performance.
The model or modeling pipeline that achieves the best performance according to your performance metric is then selected as your final model that you can then use to start making predictions on new data.
This applies to regression and classification predictive modeling tasks with classical machine learning algorithms and deep learning. It’s always the same process.
The problem is, how do you know the difference between two models is real and not just a statistical fluke?
This problem can be addressed using a statistical hypothesis test.
One approach is to evaluate each model on the same k-fold cross-validation split of the data (e.g. using the same random number seed to split the data in each case) and calculate a score for each split. This would give a sample of 10 scores for 10-fold cross-validation. The scores can then be compared using a paired statistical hypothesis test because the same treatment (rows of data) was used for each algorithm to come up with each score. The Paired Student’s t-Test could be used.
A problem with using the Paired Student’s t-Test, in this case, is that each evaluation of the model is not independent. This is because the same rows of data are used to train the data multiple times — actually, each time, except for the time a row of data is used in the hold-out test fold. This lack of independence in the evaluation means that the Paired Student’s t-Test is optimistically biased.
This statistical test can be adjusted to take the lack of independence into account. Additionally, the number of folds and repeats of the procedure can be configured to achieve a good sampling of model performance that generalizes well to a wide range of problems and algorithms. Specifically two-fold cross-validation with five repeats, so-called 5×2-fold cross-validation.
This approach was proposed by Thomas Dietterich in his 1998 paper titled “Approximate Statistical Tests for Comparing Supervised Classification Learning Algorithms.”
For more on this topic, see the tutorial:
Thankfully, we don’t need to implement this procedure ourselves.
5×2 Procedure With MLxtend
The MLxtend library by Sebastian Raschka provides an implementation via the paired_ttest_5x2cv() function.
First, you must install the mlxtend library, for example:
sudo pip install mlxtend
To use the evaluation, you must first load your dataset, then define the two models that you wish to compare.
...
# load data
X, y = ....
# define models
model1 = ...
model2 = ...
You can then call the paired_ttest_5x2cv() function and pass in your data and models and it will report the t-statistic value and the p-value as to whether the difference in the performance of the two algorithms is significant or not.
...
# compare algorithms
t, p = paired_ttest_5x2cv(estimator1=model1, estimator2=model2, X=X, y=y)
The p-value must be interpreted using an alpha value, which is the significance level that you are willing to accept.
If the p-value is less or equal to the chosen alpha, we reject the null hypothesis that the models have the same mean performance, which means the difference is probably real. If the p-value is greater than alpha, we fail to reject the null hypothesis that the models have the same mean performance and any observed difference in the mean accuracies is probability a statistical fluke.
The smaller the alpha value, the better, and a common value is 5 percent (0.05).
...
# interpret the result
if p <= 0.05:
	print('Difference between mean performance is probably real')
else:
	print('Algorithms probably have the same performance')
Now that we are familiar with the way to use a hypothesis test to compare algorithms, let’s look at some examples.
Comparing Classifier Algorithms
In this section, let’s compare the performance of two machine learning algorithms on a binary classification task, then check if the observed difference is statistically significant or not.
First, we can use the make_classification() function to create a synthetic dataset with 1,000 samples and 20 input variables.
The example below creates the dataset and summarizes its shape.
# create classification dataset
from sklearn.datasets import make_classification
# define dataset
X, y = make_classification(n_samples=1000, n_features=10, n_informative=10, n_redundant=0, random_state=1)
# summarize the dataset
print(X.shape, y.shape)
Running the example creates the dataset and summarizes the number of rows and columns, confirming our expectations.
We can use this data as the basis for comparing two algorithms.
(1000, 10) (1000,)
We will compare the performance of two linear algorithms on this dataset. Specifically, a logistic regression algorithm and a linear discriminant analysis (LDA) algorithm.
The procedure I like is to use repeated stratified k-fold cross-validation with 10 folds and three repeats. We will use this procedure to evaluate each algorithm and return and report the mean classification accuracy.
The complete example is listed below.
# compare logistic regression and lda for binary classification
from numpy import mean
from numpy import std
from sklearn.datasets import make_classification
from sklearn.model_selection import cross_val_score
from sklearn.model_selection import RepeatedStratifiedKFold
from sklearn.linear_model import LogisticRegression
from sklearn.discriminant_analysis import LinearDiscriminantAnalysis
from matplotlib import pyplot
# define dataset
X, y = make_classification(n_samples=1000, n_features=10, n_informative=10, n_redundant=0, random_state=1)
# evaluate model 1
model1 = LogisticRegression()
cv1 = RepeatedStratifiedKFold(n_splits=10, n_repeats=3, random_state=1)
scores1 = cross_val_score(model1, X, y, scoring='accuracy', cv=cv1, n_jobs=-1)
print('LogisticRegression Mean Accuracy: %.3f (%.3f)' % (mean(scores1), std(scores1)))
# evaluate model 2
model2 = LinearDiscriminantAnalysis()
cv2 = RepeatedStratifiedKFold(n_splits=10, n_repeats=3, random_state=1)
scores2 = cross_val_score(model2, X, y, scoring='accuracy', cv=cv2, n_jobs=-1)
print('LinearDiscriminantAnalysis Mean Accuracy: %.3f (%.3f)' % (mean(scores2), std(scores2)))
# plot the results
pyplot.boxplot([scores1, scores2], labels=['LR', 'LDA'], showmeans=True)
pyplot.show()
Running the example first reports the mean classification accuracy for each algorithm.
Your specific results may differ given the stochastic nature of the learning algorithms and evaluation procedure. Try running the example a few times.
In this case, the results suggest that LDA has better performance if we just look at the mean scores: 89.2 percent for logistic regression and 89.3 percent for LDA.
LogisticRegression Mean Accuracy: 0.892 (0.036)
LinearDiscriminantAnalysis Mean Accuracy: 0.893 (0.033)
A box and whisker plot is also created summarizing the distribution of accuracy scores.
This plot would support my decision in choosing LDA over LR.
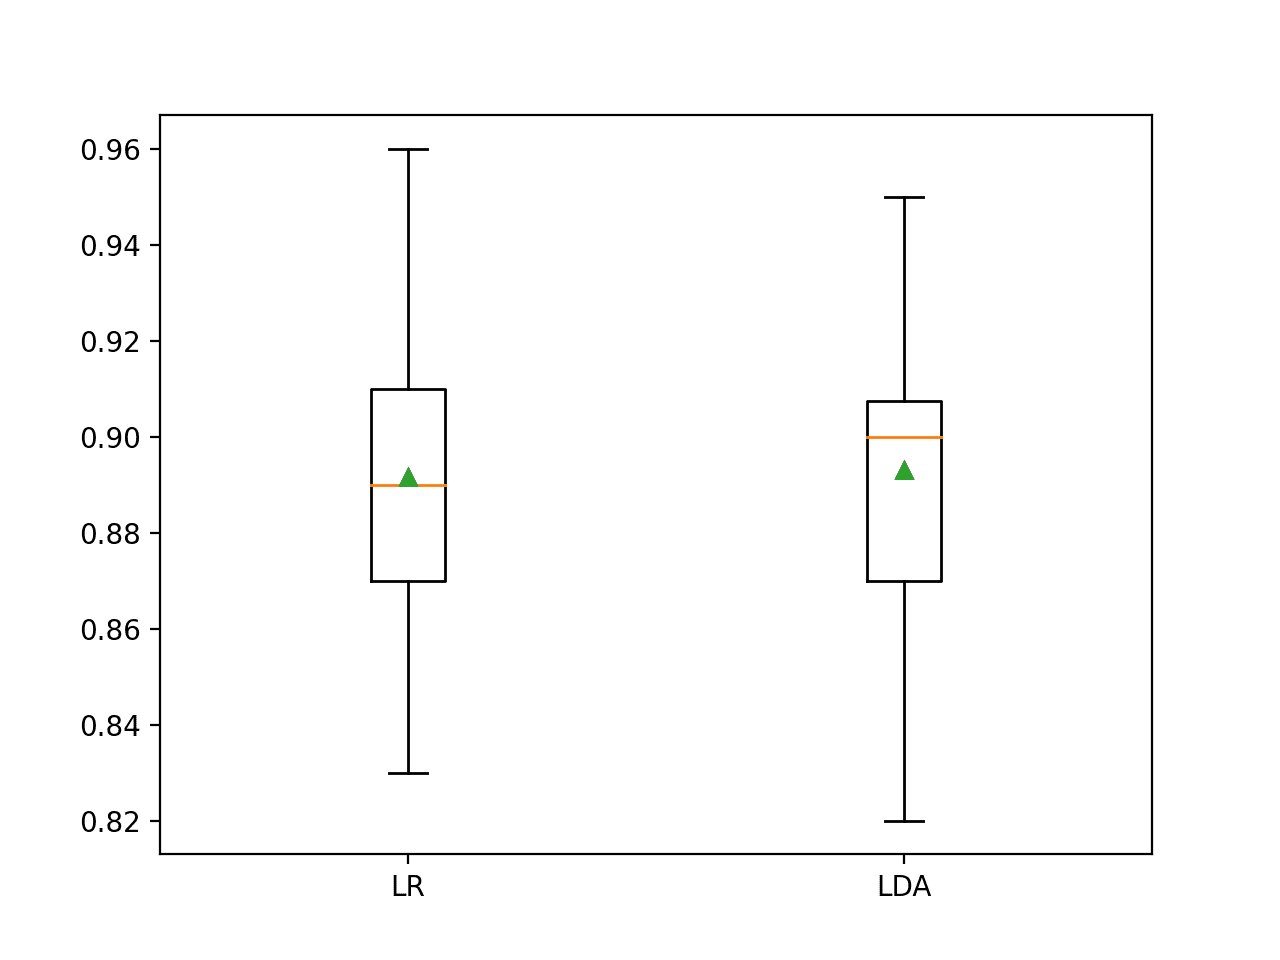
Box and Whisker Plot of Classification Accuracy Scores for Two Algorithms
Now we can use a hypothesis test to see if the observed results are statistically significant.
First, we will use the 5×2 procedure to evaluate the algorithms and calculate a p-value and test statistic value.
...
# check if difference between algorithms is real
t, p = paired_ttest_5x2cv(estimator1=model1, estimator2=model2, X=X, y=y, scoring='accuracy', random_seed=1)
# summarize
print('P-value: %.3f, t-Statistic: %.3f' % (p, t))
We can then interpret the p-value using an alpha of 5 percent.
...
# interpret the result
if p <= 0.05:
	print('Difference between mean performance is probably real')
else:
	print('Algorithms probably have the same performance')
Tying this together, the complete example is listed below.
# use 5x2 statistical hypothesis testing procedure to compare two machine learning algorithms
from numpy import mean
from numpy import std
from sklearn.datasets import make_classification
from sklearn.model_selection import cross_val_score
from sklearn.model_selection import RepeatedStratifiedKFold
from sklearn.linear_model import LogisticRegression
from sklearn.discriminant_analysis import LinearDiscriminantAnalysis
from mlxtend.evaluate import paired_ttest_5x2cv
# define dataset
X, y = make_classification(n_samples=1000, n_features=10, n_informative=10, n_redundant=0, random_state=1)
# evaluate model 1
model1 = LogisticRegression()
cv1 = RepeatedStratifiedKFold(n_splits=10, n_repeats=3, random_state=1)
scores1 = cross_val_score(model1, X, y, scoring='accuracy', cv=cv1, n_jobs=-1)
print('LogisticRegression Mean Accuracy: %.3f (%.3f)' % (mean(scores1), std(scores1)))
# evaluate model 2
model2 = LinearDiscriminantAnalysis()
cv2 = RepeatedStratifiedKFold(n_splits=10, n_repeats=3, random_state=1)
scores2 = cross_val_score(model2, X, y, scoring='accuracy', cv=cv2, n_jobs=-1)
print('LinearDiscriminantAnalysis Mean Accuracy: %.3f (%.3f)' % (mean(scores2), std(scores2)))
# check if difference between algorithms is real
t, p = paired_ttest_5x2cv(estimator1=model1, estimator2=model2, X=X, y=y, scoring='accuracy', random_seed=1)
# summarize
print('P-value: %.3f, t-Statistic: %.3f' % (p, t))
# interpret the result
if p <= 0.05:
	print('Difference between mean performance is probably real')
else:
	print('Algorithms probably have the same performance')
Running the example, we first evaluate the algorithms before, then report on the result of the statistical hypothesis test.
Your specific results may differ given the stochastic nature of the learning algorithms and evaluation procedure. Try running the example a few times.
In this case, we can see that the p-value is about 0.3, which is much larger than 0.05. This leads us to fail to reject the null hypothesis, suggesting that any observed difference between the algorithms is probably not real.
We could just as easily choose logistic regression or LDA and both would perform about the same on average.
This highlights that performing model selection based only on the mean performance may not be sufficient.
LogisticRegression Mean Accuracy: 0.892 (0.036)
LinearDiscriminantAnalysis Mean Accuracy: 0.893 (0.033)
P-value: 0.328, t-Statistic: 1.085
Algorithms probably have the same performance
Recall that we are reporting performance using a different procedure (3×10 CV) than the procedure used to estimate the performance in the statistical test (5×2 CV). Perhaps results would be different if we looked at scores using five repeats of two-fold cross-validation?
The example below is updated to report classification accuracy for each algorithm using 5×2 CV.
# use 5x2 statistical hypothesis testing procedure to compare two machine learning algorithms
from numpy import mean
from numpy import std
from sklearn.datasets import make_classification
from sklearn.model_selection import cross_val_score
from sklearn.model_selection import RepeatedStratifiedKFold
from sklearn.linear_model import LogisticRegression
from sklearn.discriminant_analysis import LinearDiscriminantAnalysis
from mlxtend.evaluate import paired_ttest_5x2cv
# define dataset
X, y = make_classification(n_samples=1000, n_features=10, n_informative=10, n_redundant=0, random_state=1)
# evaluate model 1
model1 = LogisticRegression()
cv1 = RepeatedStratifiedKFold(n_splits=2, n_repeats=5, random_state=1)
scores1 = cross_val_score(model1, X, y, scoring='accuracy', cv=cv1, n_jobs=-1)
print('LogisticRegression Mean Accuracy: %.3f (%.3f)' % (mean(scores1), std(scores1)))
# evaluate model 2
model2 = LinearDiscriminantAnalysis()
cv2 = RepeatedStratifiedKFold(n_splits=2, n_repeats=5, random_state=1)
scores2 = cross_val_score(model2, X, y, scoring='accuracy', cv=cv2, n_jobs=-1)
print('LinearDiscriminantAnalysis Mean Accuracy: %.3f (%.3f)' % (mean(scores2), std(scores2)))
# check if difference between algorithms is real
t, p = paired_ttest_5x2cv(estimator1=model1, estimator2=model2, X=X, y=y, scoring='accuracy', random_seed=1)
# summarize
print('P-value: %.3f, t-Statistic: %.3f' % (p, t))
# interpret the result
if p <= 0.05:
	print('Difference between mean performance is probably real')
else:
	print('Algorithms probably have the same performance')
Running the example reports the mean accuracy for both algorithms and the results of the statistical test.
Your specific results may differ given the stochastic nature of the learning algorithms and evaluation procedure. Try running the example a few times.
In this case, we can see that the difference in the mean performance for the two algorithms is even larger, 89.4 percent vs. 89.0 percent in favor of logistic regression instead of LDA as we saw with 3×10 CV.
LogisticRegression Mean Accuracy: 0.894 (0.012)
LinearDiscriminantAnalysis Mean Accuracy: 0.890 (0.013)
P-value: 0.328, t-Statistic: 1.085
Algorithms probably have the same performance
Further Reading
This section provides more resources on the topic if you are looking to go deeper.
Tutorials
- 17 Statistical Hypothesis Tests in Python (Cheat Sheet)
- How to Calculate Parametric Statistical Hypothesis Tests in Python
- Statistical Significance Tests for Comparing Machine Learning Algorithms
Papers
APIs
Summary
In this tutorial, you discovered how to use statistical hypothesis tests for comparing machine learning algorithms.
Specifically, you learned:
- Performing model selection based on the mean model performance can be misleading.
- The five repeats of two-fold cross-validation with a modified Student’s t-Test is a good practice for comparing machine learning algorithms.
- How to use the MLxtend machine learning to compare algorithms using a statistical hypothesis test.
Do you have any questions?
Ask your questions in the comments below and I will do my best to answer.
The post Hypothesis Test for Comparing Machine Learning Algorithms appeared first on Machine Learning Mastery.